


プログラミングを独学で始めるために必須のサービス・ツール・OSSの使い方を紹介します
各種サービス・ツール・OSSの使い方
【Python】圧縮アルゴリズム(zlib、gzip、bz2)の速度・圧縮率の比較【サンプルあり】
0
Python(sklearn+numpy)で決定係数を算出するメソッド【サンプルコードあり】
2
Python(Pandas+enumerate関数)でカテゴリ別の直近の観測データを抽出する方法【サンプルコードあり】
2
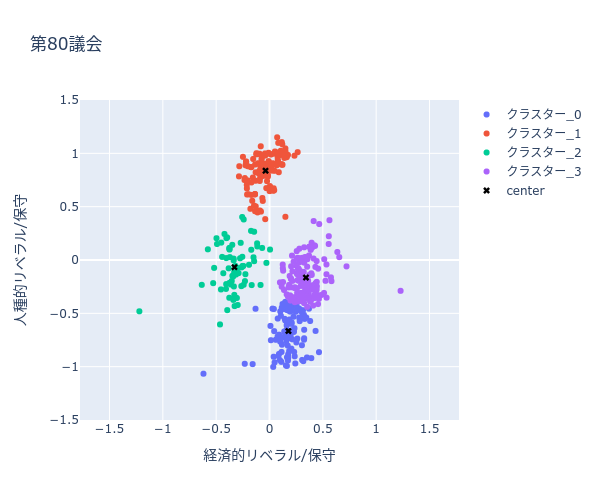
【Python】k-meansでクラスタリングして plotly で可視化する方法【サンプルコードあり】
2
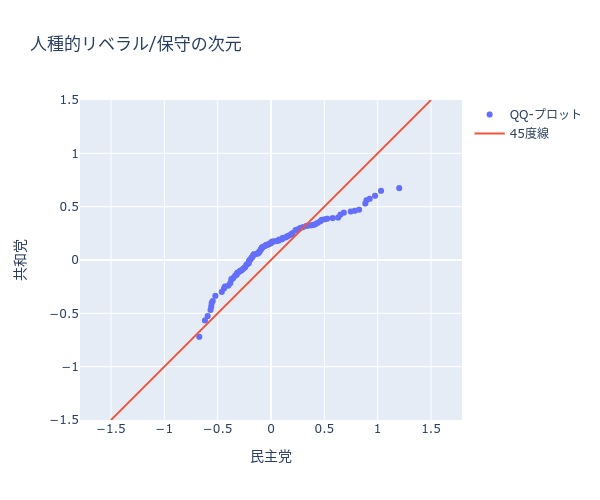
Python(Pandas+Plotly)でQ-Qプロットを出力して2変数の分布を比較する方法【サンプルコードあり】
2
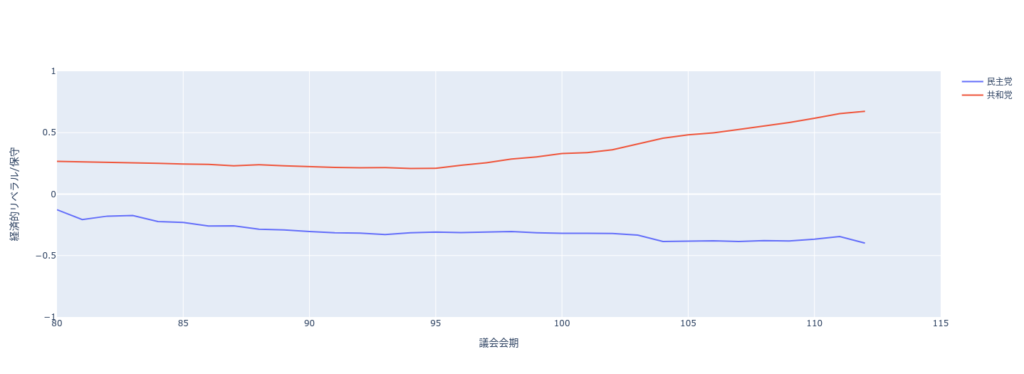
Python(Pandas+Plotly)で中央値の時系列の推移を比較する方法を紹介【サンプルコードあり】
2
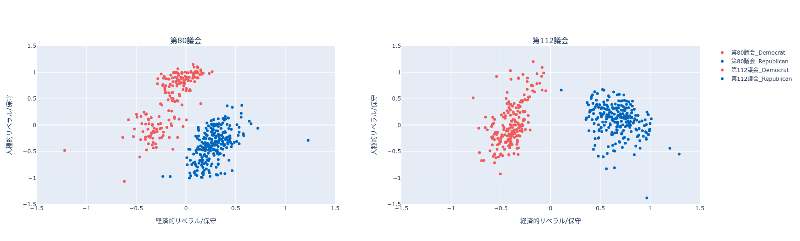
Python(Pandas+Plotly)で散布図を並べて出力する方法を紹介【色コード指定可】【サンプルコードあり】
2
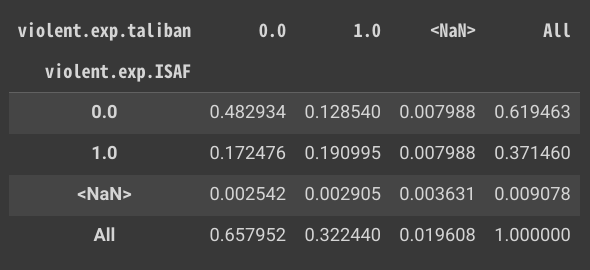
[Python]Pandasでクロス集計表にNaNの割合を出力する方法【サンプルコードあり】【地味に嬉しい】
2
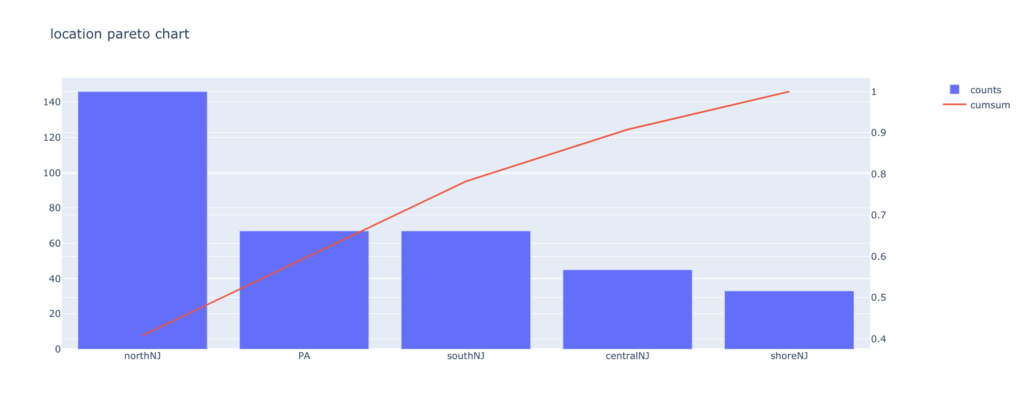
【Python】パレート図の作り方を紹介【サンプルコードあり】【Pandas+Plotly】【すぐに使える】
2
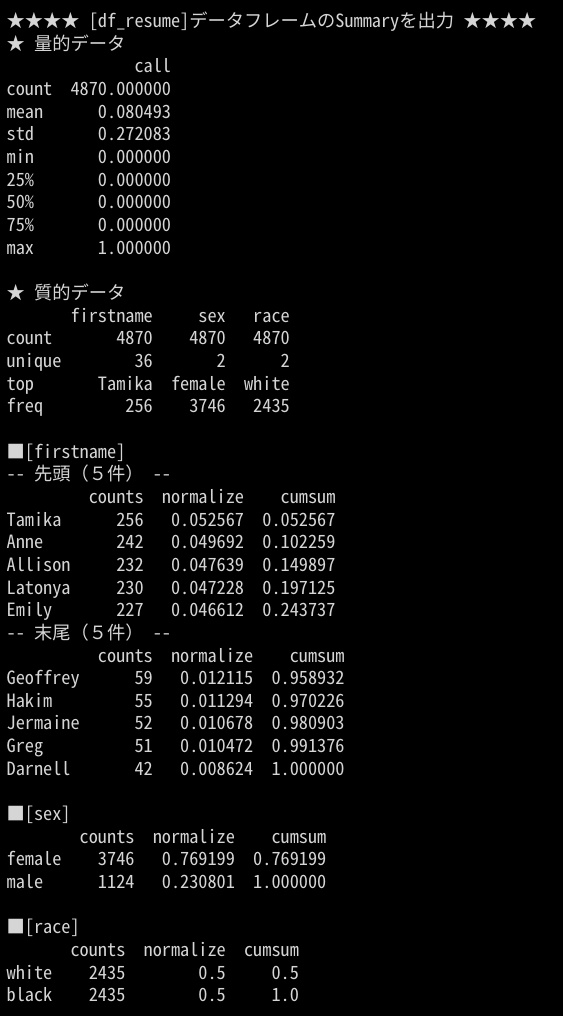
Python(Pandas)でデータの特徴を出力するコードを紹介【R言語のSummary()ライク】
2